[01] Case Study
Scalable Choreography: SC2025
How do you make complex metadata management systems comprehensible to an audience of 18,000 supercomputing experts? Scalable Choreography bridged the gap between embodied expression and high-performance computing (HPC) by using dance as a rigorous data visualization tool.
[02] Quick Facts
[03] Introduction
Bringing Dance to Super Computing
In collaboration with Arcitecta, we brought dance to SC2025 not as entertainment, but as a rigorous data visualization tool. The core premise was a metaphor for distributed computing: Distributed computing is like choreography.
Multiple processors (dancers) work simultaneously toward a unified goal, each following different algorithmic paths to achieve the same result.
[04] The Approach
Generative Systems & Patterns
We proved that interesting choreography could be created generatively using systems and patterns rather than traditional composition methods. The movement emerged from mathematical rules.
The Generative Algorithm
Each of the 5 dancers represented a data node, assigned a unique mathematical function:
- Dancer 1: Standard Sine Wave (A · sin(ωt))
- Dancer 2: Phase-Shifted Wave (offset by 90°)
- Dancer 3: Composite Wave (Sum of Dancer 1 + Dancer 2)
- Dancer 4 & 5: Variable amplitudes and phase shifts
From Math to Movement
The dancers were given a framework to generate 12 unique poses. These poses were mapped onto their assigned sine wave trajectories. The dancers' vertical positions on stage were dictated by their equation's value at that specific moment.
Complex, interlocking patterns emerged naturally. The "choreography" was simply the visualization of the math.
[05] Scalability
From 5 to Infinite
A key discovery was the inherent scalability of this generative approach. While we stopped at five dancers for the physical performance, the system is designed to apply to a scalable amount of dancers.
Because the choreography is rule-based rather than fixed, we could theoretically input an "infinite" number of dancers, each with a unique variable in the equation, and the system would generate a coherent, non-colliding group choreography.
Whether you have 5 data points or 5 million, the choreographic rules hold, creating a "Murmuration" effect that turns abstract data into a comprehensible organic flow.
[06] Process
The "Murmuration" Pivot
We initially tried to create a "visual murmuration" using feedback loops on video footage, tracking dancers by shirt color. However, shirt colors blended with skin tones, creating messy visuals.
The Solution: We pivoted to AI Pose Estimation (MediaPipe/PoseNet). Instead of relying on raw video pixels, we trained an AI to recognize discrete poses and map the skeleton joints in 3D space. This allowed us to strip away the "messiness" and reveal the pure mathematical skeleton underneath - the "bone structure" of the data.
The Human Element in Algorithms
Interestingly, the "errors" in the system were as valuable as the precision. Unlike digital processors, human dancers take up physical space. When five sine waves converged, dancers had to "negotiate" their proximity, subtly adjusting to avoid collision. This introduced a layer of organic "noise" or "latency" into the system, making the visualization more relatable.
[07] Research Phases
Three Approaches, One Question
The technical development happened across four months and three distinct phases - each one trying to solve the same problem in a different way: how do you clearly show that five dancers are following sine wave patterns?
2D video distortion in After Effects and TouchDesigner. Blending all frames to show movement trails. Tracking colored shirts to reveal sine curves.
HTML, JavaScript, and Python implementation. MediaPipe pose detection. Mapping detected poses onto a 3D grid in real time.
Houdini 3D environment. Rigged mesh bodies with movement trails. GLSL shaders and lighting composition.
[08] Phase 1
The Murmuration Approach
The first attempt used a feedback loop - compressing and blending all frames of the footage into a single image that showed where each dancer was at every frame. The goal was to track each dancer's shirt color so the five individual sine wave trails would be identifiable by color alone.
The approach failed. The color of the dancers' arms during poses interfered with the shirts, producing a trail of skin tone instead of clean color feedback. Communicating that each dancer was following a distinct sine wave pattern was harder than expected.

[09] Phase 2
Pose Estimation and 3D Mapping
Pose estimation offered a faster way to confirm when each pose was executed, letting us work backwards and visualize how many times a given pose occurred and in what order. The goal was to show that choreography can be complex, rule-based, and countable - the same logic that makes code readable.
The main challenge: MediaPipe does not natively map poses into 3D space. Each pose needed to be manually tracked on a linear timeline so it advanced across the stage. Working in HTML, JavaScript, and Python - tools that were new at the time - the phase stalled at one dancer before the next iteration was needed.


[10] Phase 3
The Askew Grid and Motion Capture
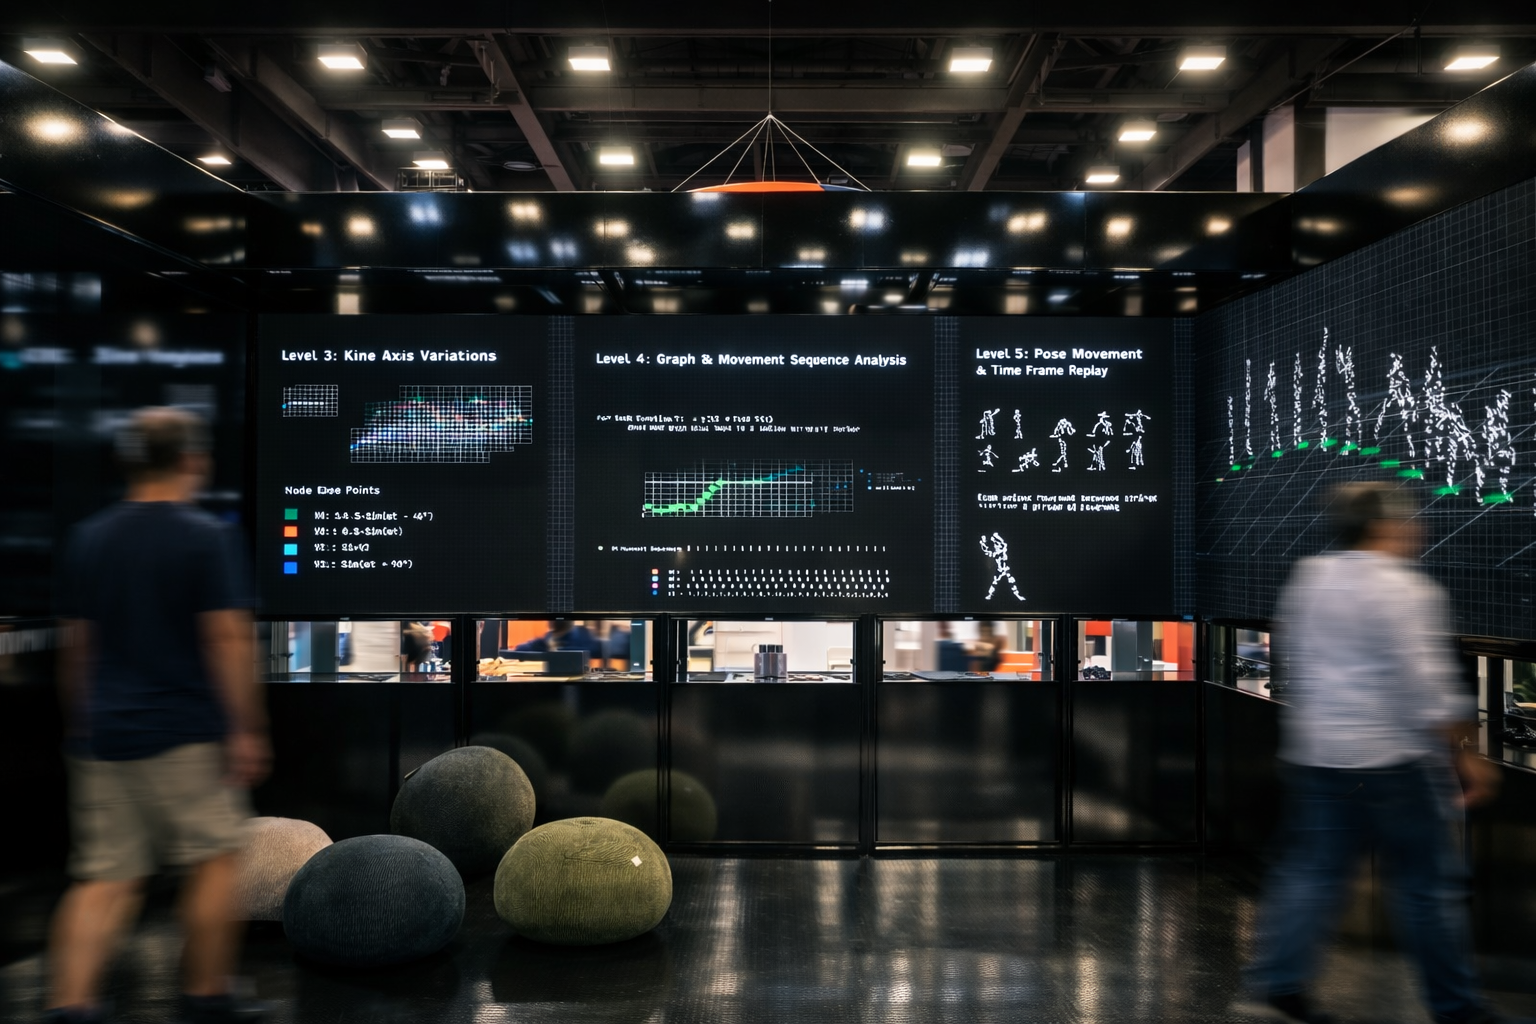
When the live 3D mapping wasn't reading clearly, I stepped back and looked at how designers communicate abstract datasets - specifically, poster-like compositions where all information is visible at once. This led to the "Askew Grid": a structure that divides information into ascending layers of density, from raw documentation to full abstraction, so a first-time viewer can find their footing.
Anna and I agreed the final 3D piece could stand alone as a visual experience. A viewer who had followed the full arc - from math rule to choreographic sequence to spatial visualization - would arrive at that last frame with comprehension rather than confusion.


[11] Challenges
What Was Actually Hard
The Technical Problem
Communicating the story in a coherent and legible way. The first Askew Grid attempts were overwhelming - too many rules for someone new to the process to absorb at once. TouchDesigner was essential here: it's non-destructive, so visual techniques like feedback could be iterated much faster than in After Effects, where each committed step is permanent.
The Conceptual Problem
Balancing mathematical precision with organic human movement. Dancers can't hit an exact pose every time, especially five of them in close proximity negotiating space. What held firm was the rule-based sequence each dancer followed - the specific order of poses was unwavering. Only the execution of individual poses bent to accommodate proximity.
Using footage of all five dancers together. The filming space was not a photography studio, so uncontrolled elements compounded into images that were too messy to work with cleanly downstream.
[12] Collaboration
Dividing the Work
Anna headed the sine wave rules - generating the algorithmic framework and assigning unique movement trajectories to each dancer. In a single three-hour rehearsal, five dancers produced twelve unique poses and familiarized themselves with their individual sequences. The work was efficient because the framework was airtight.
I led the design and interpretation work - 3D modelling, 2D video distortion, and the visual communication of the system. The collaboration worked because we share a common language around generative procedural choreography. Nothing needed to be explained from scratch.
Anna said that even just seeing the trajectory of a sine wave being traced by a dancer's movement pathway was enough for the work to be comprehensible. That single note simplified the entire approach and gave permission to prioritize clarity over complexity.

[13] Conclusion
This project shows that research through design is inherently iterative, messy, and non-linear - and that is where the value lives. Each failed approach taught something that shaped the next. The 44-day gap between July and August screenshots represents weeks spent wrestling with JavaScript before the MediaPipe pose estimation worked at all. The rapid acceleration in late September came from a single breakthrough: the Askew Grid methodology, which made it possible to layer complexity without losing the viewer.
Five dancers executing unique sine wave patterns in synchronized time is a precise metaphor for distributed processors working toward the same goal through different algorithmic paths. The work proved it. Another choreographer could take the rule-based approach, the pose catalog methodology, and the visualization techniques and apply them to something entirely different. The system is transferable.